

Anomaly Detection algorithms monitor the sensor trend from Equipment in real-time to detect any deviation from normal behavior. What to do when the algorithm flags a deluge of alerts as an anomaly while the equipment is functioning satisfactorily? Or what if the algorithm does not flag an actual anomaly when the equipment is progressing toward failure?
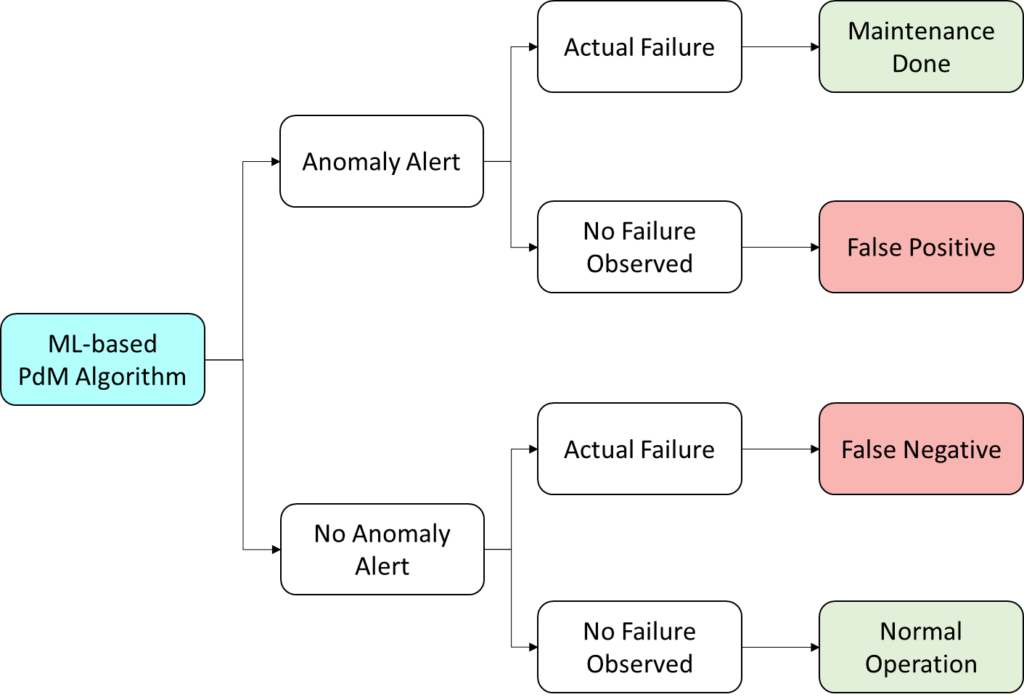
‘False Positive’ Alerts are undesired and a waste of resources in inspecting the equipment or stopping production. ‘False Negative’ Alerts are equivalent to not having a detection algorithm. Both are unwanted situations.
How do we balance the errors in model development?
Build the algorithm with penalty costs for each situation loaded.
Classification Algorithms underpin Anomaly Detection applications. The models use a threshold to classify the data points between the “Healthy state” & “Failed state”. Establishing the threshold is influenced by the Cost Matrix, which is a weight function used by the model to reduce fitting error.
The two metrics used to evaluate the performance of classification models are “Precision” & “Recall”. In simple terms:
- Precision is the measure of correctly detecting actual failure among all predicted failures.
- Recall is the measure of correctly detecting actual failure among all actual failures.
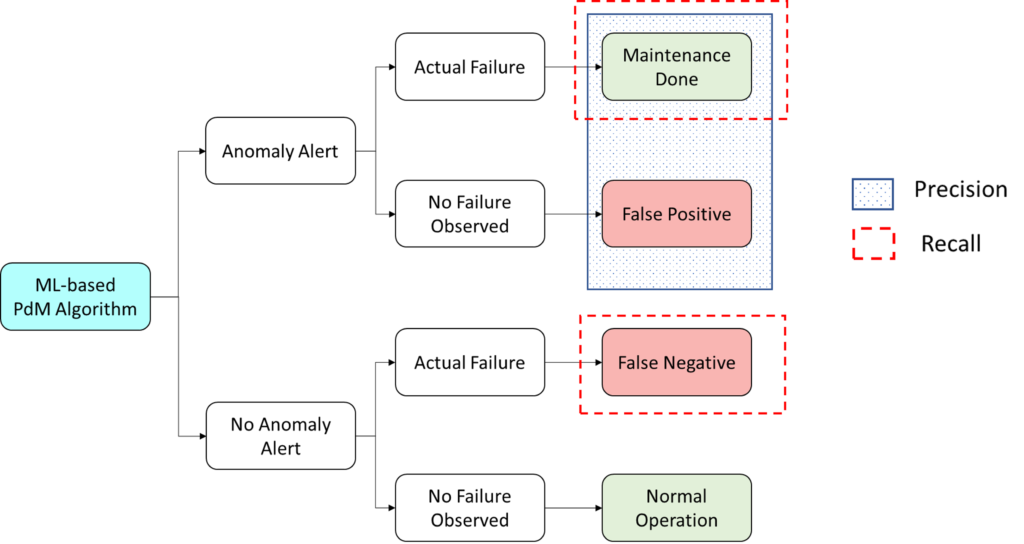
Precision & Recall are inversely proportional and can be tuned by setting the Cost Matrix. By taking the opposite approach, Reliability Engineers can work with ML engineers to define the Cost Matrix to meet the maintenance demands of the monitored Equipment.
- For Equipment with a high cost of False Positives, the cost matrix is set to give higher Precision (and lower Recall). Example: Wind Turbine Maintenance: technician dispatch to offshore, getting work permits, and disassembly is expensive if it is False Alarm & Equipment is healthy.
- For Equipment with a high cost of False Negatives, the cost matrix is set to give higher Recall (and lower Precision) (This is the common case for Reliability Engineers). Example: Production Fermenters: not detecting a failure will result in total production loss, higher corrective maintenance costs, and ancillary damage.
A combined metric called ROC Curve is used by ML engineers to get the balance between Precision & Recall. But the below plot will inform Reliability & Maintenance professionals how to guide ML engineers in their model building.
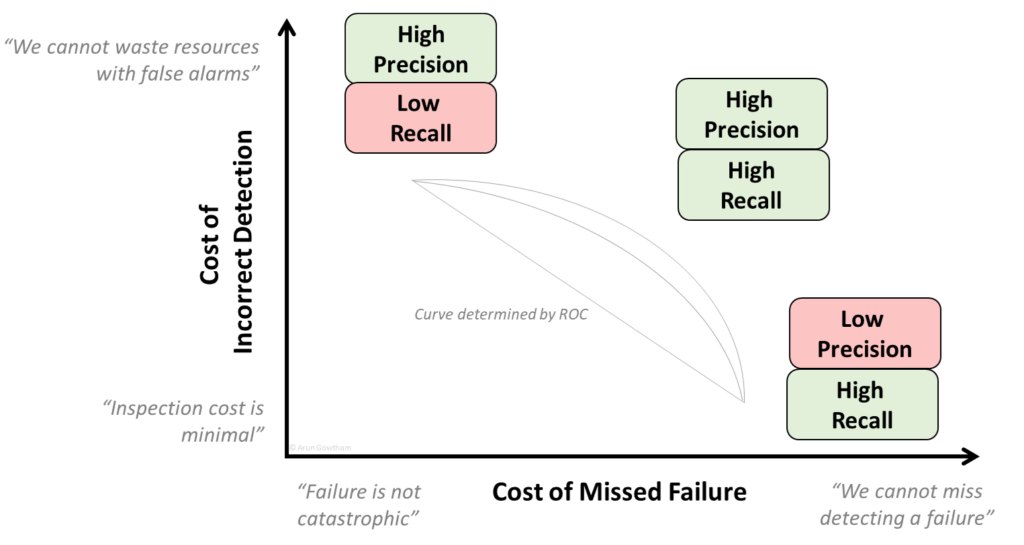
Following where the Equipment’s criticality lies on the above plot will establish target metrics for Precision & Recall, which then will drive the number of False Positives & False Negatives in your algorithm.
We can help your organization set up Anomaly Detection algorithms to suit the maintenance needs. Contact Owtrun for a free consultation.
Related Posts

Video: Transforming Industrial Maintenance with AI & IIOT
Dynamic P-F Curve