
TL;DR: Remaining Useful Life is the time between the point of measurement and the Functional Failure of the asset.
Recently, there has been an influx of Industry 4.0 companies promising their product/application would help predict the Remaining Useful Life (RUL) of a physical asset. Each uses a mix of machine learning algorithms to estimate the RUL based on the data available. This is their value proposition. But what is this ‘life’? Is it a constant value or a range? If it’s predicted, does that mean the culmination of the efforts to manage assets? Can we rely on this calculation and base all other Maintenance Work on it? I intend to explain the Remaining Useful Life in this article by comparing it with a well-known concept.
P-F Curve
Maintenance & Reliability Professionals are familiar with the P-F Curve. It’s the graphic representation of an item’s Resistance to Failure against Time. The curve says two things: 1) Each failure is preceded by a symptom; 2) Resistance degrades over time. The point where the symptom of an impending failure is observed is called Potential Failure and the point where the resistance becomes unsatisfactory is called Functional Failure. The time interval between these points is the P-F Interval.
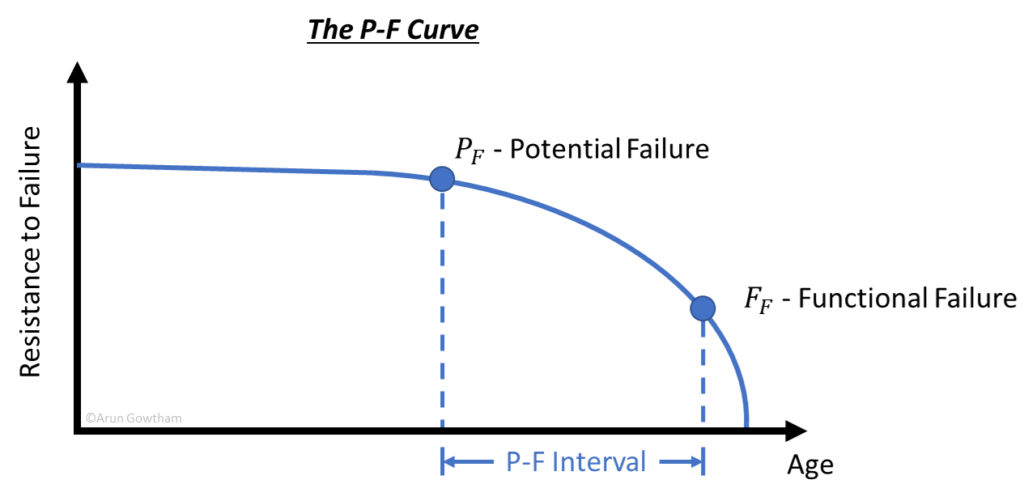
The versatility of the P-F Curve enables it to capture the behavior of all the known asset failure patterns. Even if an asset exhibits infant mortality or a constant failure rate pattern, they can be represented in a P-F Curve because the asset will show some symptom of impending failure before the actual failure. In the extremely rare case of no indication & a snap failure, the P-F Curve is drawn as a short steep curve with the P and F points very close. Regardless of the curve shapes, the Functional Failure is the point of failure (or unsatisfactory performance) and hence the total time taken for the asset to reach this point is its ‘Useful Life’. In other words, it’s the time for which the asset will perform its function satisfactorily.
Remaining Useful Life
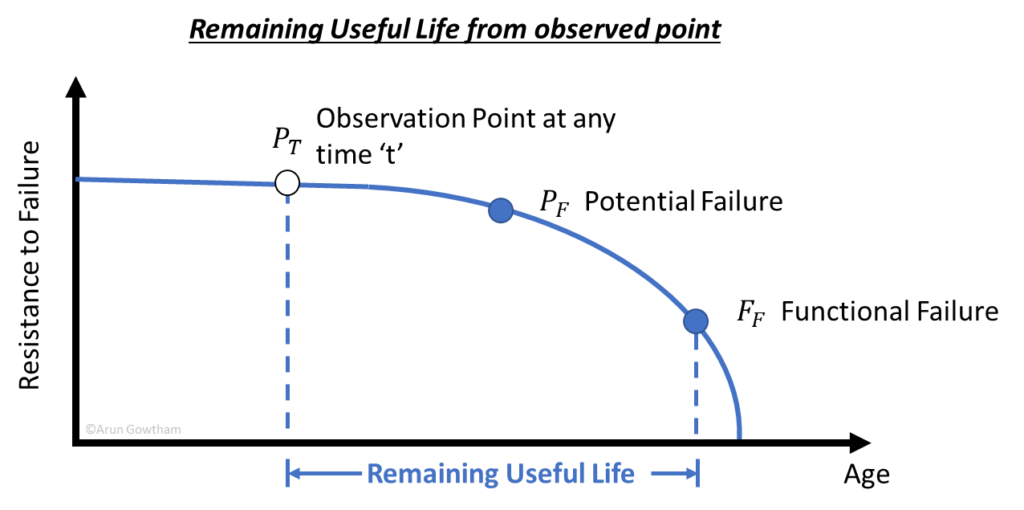
If we measure the useful life left from a different point along the curve instead of the beginning, then we get the ‘Remaining Useful Life’ from that time. Let’s say you have an asset that has been running for 6 months, and you want to know how many more months it will function without failure. You get this by measuring the time between now (t) and the Functional Failure. Observation point can be anywhere; if it is at the potential failure point then RUL is same as P-F Interval.
Calculating RUL with algorithms
Predictive algorithms, used by Industry 4.0 apps, will generalize the system data to fit into these curves and measure the time to functional failure. Since the historical data contains variations (from conditions, design, and operations), each point on the curve is a probability distribution (pdf). i.e., the same P-F Curve when repeated will exhibit a distribution of curves. Because of this, the Functional failure point is also a distribution. Evidently, measuring the time between two distributions will also give a distribution. Hence, we have the Remaining Useful Life of an asset as a range of values with a probability of occurrence.
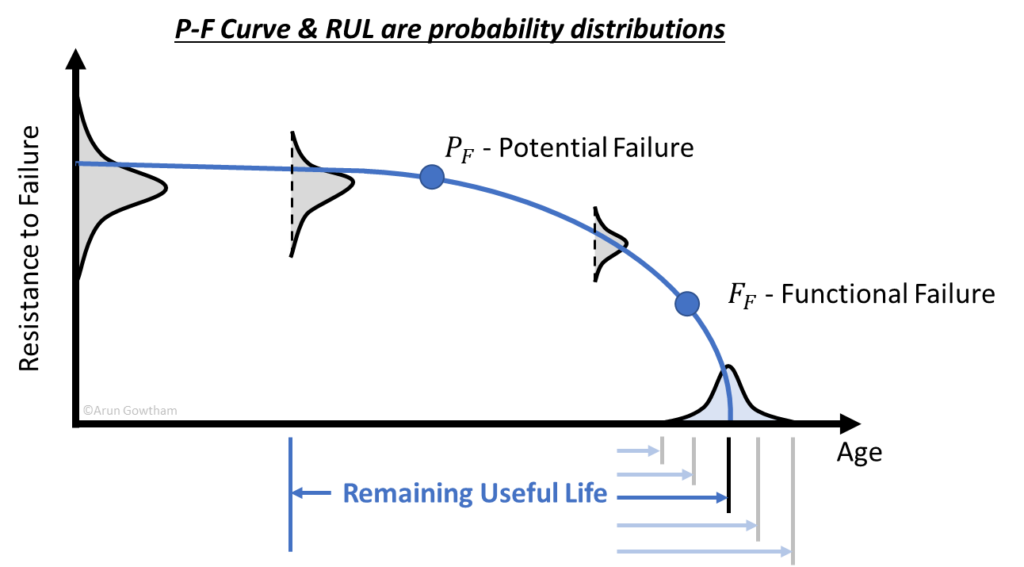
Predictions carry uncertainty with it and the curves above show how the uncertainty is quantified. One advantage of the algorithms is that as time progresses and more data is fed, the uncertainty reduces. So, the RUL estimation will be more uncertain at the beginning of asset life and will get certain as the asset reaches its functional failure. To avoid reporting distributions, use the median of the RUL distribution to denote the RUL as a singular value. Given this interpretation, we can finally define:
Remaining Useful Life (RUL) is a probabilistic estimate of the time period until which the asset will continue to perform its intended function under stated conditions
Estimating RUL with high accuracy is just the first part. Maintenance Work must leverage this information with other factors to tie-in with the broader framework to effectively manage assets.
This article came out of a conference paper I co-wrote with Gary Josebeck for RAMS 2022 Conference: “Demystifying the P-F curve & Augmenting Machine Learning for Maintenance Optimization”
Related Posts

Video: Transforming Industrial Maintenance with AI & IIOT

How to deal with ‘False Positives’ from ML algorithms?